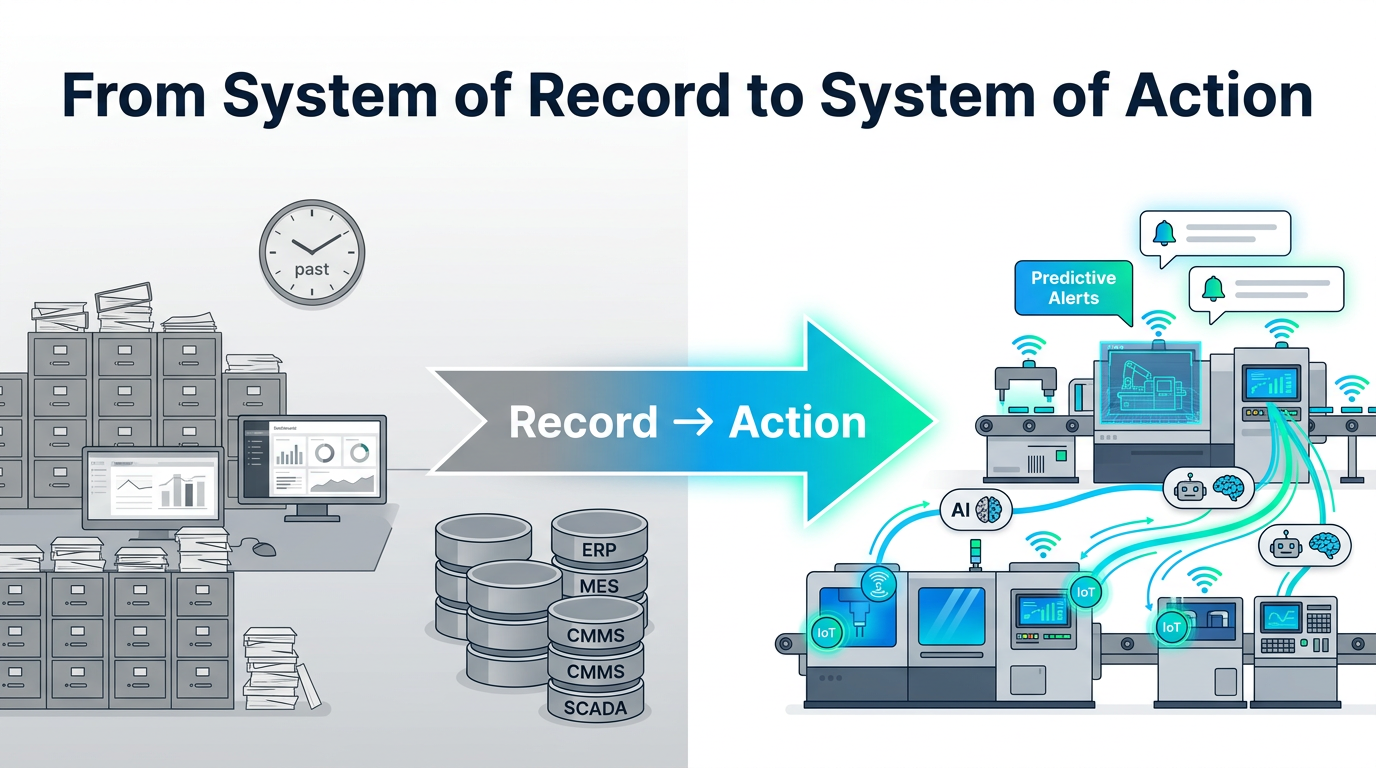
For three decades, manufacturing has run on systems of record — ERP platforms, MES databases, maintenance logs, and SCADA historians that faithfully capture what happened on the factory floor. SAP recorded every work order. Oracle tracked every purchase. Historians stored every sensor reading. But recording what happened is not the same as knowing what to do next. In 2026, that distinction is no longer academic — it is the dividing line between manufacturers who react to disruption and those who prevent it. We are witnessing a generational shift: from systems of record to systems of action, powered by AI agents that don’t just store data but act on it.
This article breaks down what the shift means for factories and industrial enterprises, provides concrete implementation guidance using Microsoft’s Fabric IQ platform (Fabric IQ, Work IQ, and Foundry IQ), and walks through the real-world Industrial AI scenarios — predictive maintenance, IoT digital twins, quality control, and energy optimization — where systems of action deliver measurable ROI.
What Is a System of Record in Manufacturing?
A system of record is software designed to be the single source of truth for operational data. In manufacturing, that includes:
- ERP systems (SAP, Oracle, Dynamics 365) — storing purchase orders, BOMs, production orders, and financial transactions
- MES platforms (Siemens Opcenter, Rockwell Plex) — logging production execution, batch records, and OEE metrics
- CMMS tools (IBM Maximo, SAP PM) — recording maintenance work orders, equipment histories, and spare parts inventories
- SCADA/Historian databases (OSIsoft PI, Honeywell PHD) — capturing time-series sensor data from PLCs and IoT devices
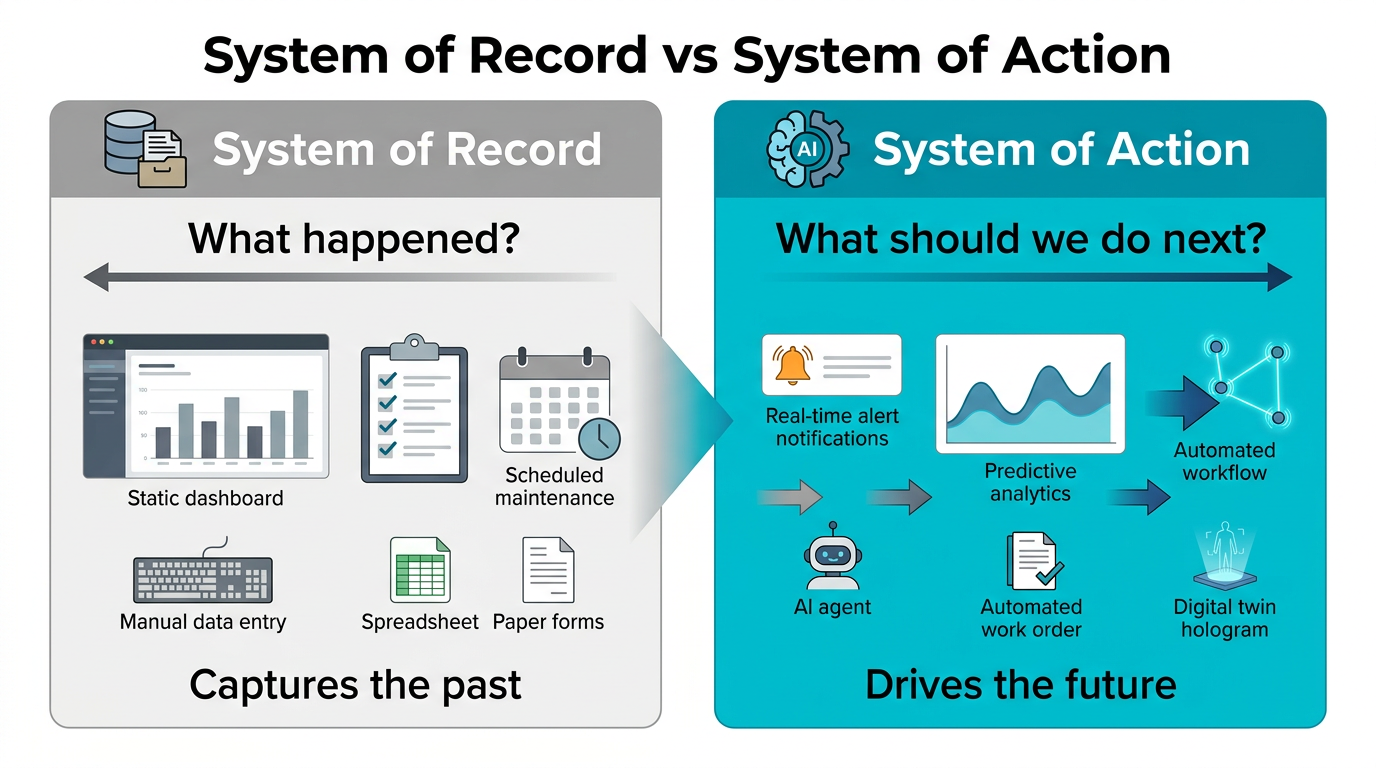
These systems are essential. Without them, a factory cannot comply with ISO or FDA regulations, forecast production capacity, or trace a defect back to its source. But they share a fundamental limitation: they are backward-looking. They answer “What happened?” and “What is the current state?” — but never “What should we do next?”
Why Systems of Record Are No Longer Enough
The limitations of record-first thinking become painfully visible in three scenarios that every manufacturer recognizes.
Reactive Maintenance Traps
Your CMMS contains 15 years of maintenance work orders for a CNC machining center. It records every bearing replacement, every spindle rebuild, every unplanned downtime event. But when the vibration sensor on that same machine starts showing an anomalous pattern at 2 AM on a Tuesday, the CMMS does nothing. A maintenance technician might spot the trend — if they happen to check the right dashboard at the right time. In practice, the machine runs until it breaks. The average unplanned downtime event in discrete manufacturing costs €15,000–€50,000 when you factor in lost production, emergency parts, and overtime labor.
Quality Escapes from Disconnected Data
Your MES logs every inspection result. Your SPC system flags out-of-spec measurements. Your ERP tracks customer complaints. But these systems don’t talk to each other in real time. A subtle shift in raw material properties (recorded in your incoming inspection system) combined with a temperature drift in your heat treatment furnace (recorded in your SCADA) produces parts that pass individual inspection steps but fail in the field. A system of record captures each data point. A system of action would correlate them before the defective parts ship.
Energy Waste Hidden in Silos
Your building management system records HVAC energy consumption. Your MES records production schedules. Your utility meter records peak demand charges. But no one connects them. The compressed air system runs at full pressure during the night shift when only 30% of machines are operating. The chiller ramps up 45 minutes before the furnaces are even lit. A system of record tells you that last month’s energy bill was €47,000. A system of action would have reduced it by 15–25% by coordinating production schedules with energy-intensive equipment.
What Is a System of Action?
A system of action starts from a different premise: data exists to drive decisions, not just to be stored. It layers intelligence and automation on top of your existing systems of record, turning historical data, real-time sensor streams, and organizational knowledge into automated workflows and AI-driven recommendations.
The distinction maps cleanly to manufacturing operations:
| Dimension | System of Record | System of Action |
|---|---|---|
| Primary question | “What happened on the production line?” | “What should we do about it — now?” |
| Data orientation | Past — logs, records, histories | Future — predictions, recommendations, automated actions |
| Maintenance model | Reactive or calendar-based preventive | Condition-based predictive with automated work order generation |
| Quality approach | Post-inspection detection (SPC after the fact) | Real-time anomaly correlation across process parameters |
| Energy management | Monthly utility bill analysis | Real-time load optimization coordinated with production schedule |
| Knowledge capture | Tribal knowledge in people’s heads | Decision traces — searchable, auditable, compounding |
| Scaling model | More data = more storage | More data = smarter decisions |
The key insight from both Bessemer’s AI Systems of Action roadmap and Foundation Capital’s context graph thesis is that this shift doesn’t require ripping out existing systems. Systems of action layer on top of systems of record. Your ERP, MES, and CMMS remain the canonical data stores. The action layer reads from them, reasons across them, and writes decisions back.
The Context Graph: Why Decision Traces Matter on the Factory Floor
Foundation Capital introduces a powerful concept: the context graph — a structured, queryable record of how decisions were made, not just what the outcomes were. In manufacturing, this is transformational.
Consider a real scenario: a maintenance engineer decides to replace a gearbox on a packaging line two weeks ahead of the preventive maintenance schedule. Why? Because the vibration signature matched a pattern from a failure on the same equipment model at another plant 18 months ago, and the production calendar shows a critical customer order next week that cannot tolerate downtime. That reasoning — the cross-referencing of vibration data, failure history, production schedule, and customer priority — lives entirely in the engineer’s head. The CMMS just records “gearbox replaced.”
A system of action with a context graph captures the full decision trace: the inputs gathered across systems, the exception to the PM schedule, the engineer who made the call, the precedent referenced, and the outcome observed. Over time, these traces become searchable organizational memory. The next engineer facing a similar vibration pattern doesn’t start from scratch — they have a library of past decisions and their results.
This is what moves manufacturing from data-rich but knowledge-poor to genuinely intelligent operations.
Industrial AI Scenarios: Where Systems of Action Deliver ROI
The shift from record to action isn’t theoretical. Here are the specific industrial AI use cases where we see measurable results in 2026.
Scenario 1: Predictive Maintenance and Machine Breakdown Prevention
The problem: Unplanned downtime costs discrete manufacturers 3–5% of annual revenue. Calendar-based preventive maintenance either replaces parts too early (wasting 20–40% of remaining useful life) or too late (after the failure has already begun).
System of record approach: CMMS logs work orders. Historian stores vibration, temperature, and current draw data. A maintenance manager reviews dashboards weekly and adjusts PM schedules annually based on failure history.
System of action approach: AI agents continuously analyze real-time sensor streams (vibration, thermal imaging, acoustic emission, motor current signatures) against historical failure patterns. When a degradation pattern is detected, the system automatically:
- Calculates remaining useful life with confidence intervals
- Checks spare parts availability in the ERP
- Reviews the production schedule for the optimal maintenance window
- Generates a work order in the CMMS with the specific failure mode, recommended parts, and estimated labor
- Notifies the relevant maintenance team via Teams or the shift handover system
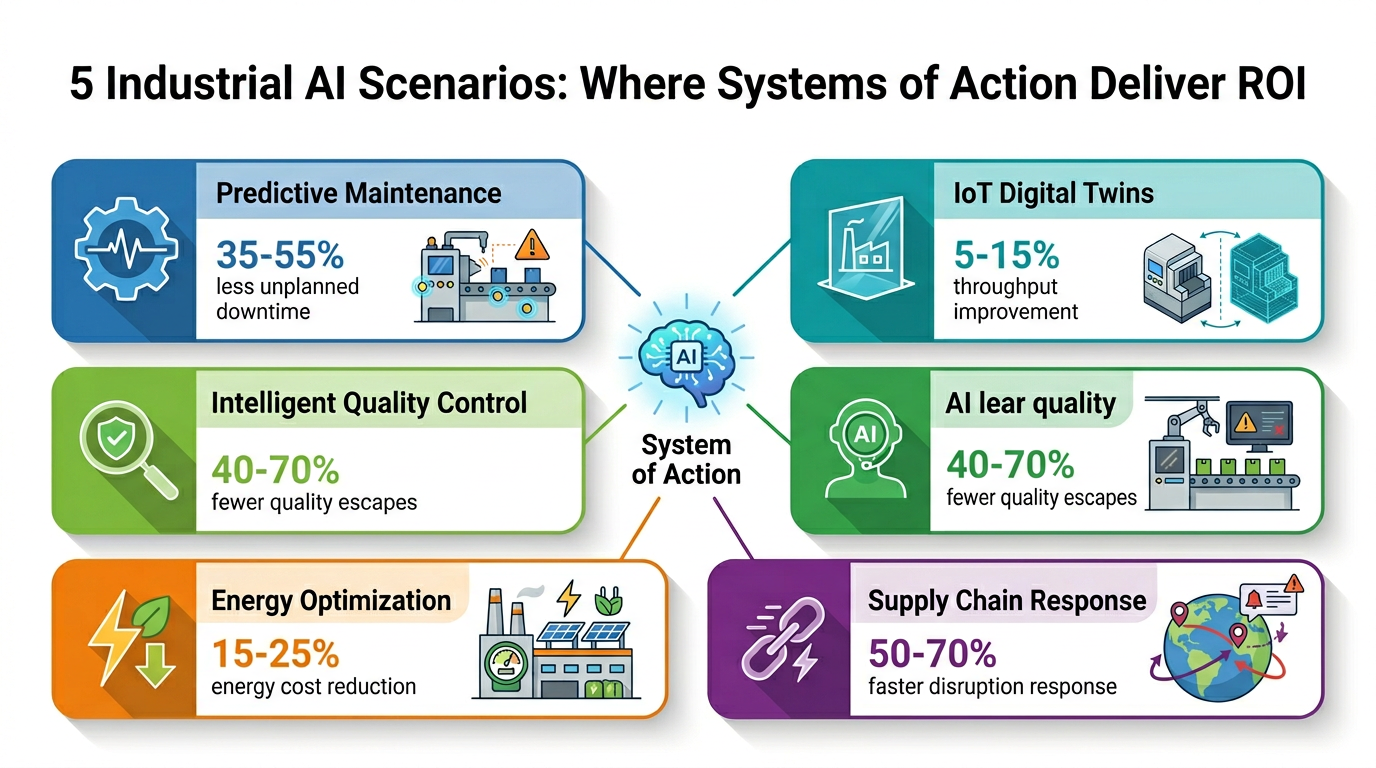
Measured results: Manufacturers deploying predictive maintenance systems of action report 35–55% reduction in unplanned downtime, 20–30% reduction in maintenance costs through elimination of unnecessary PM tasks, and 15–25% extension of equipment useful life.
Scenario 2: IoT Digital Twins for Production Optimization
The problem: A factory running 50+ machines with hundreds of process parameters has more variables than any human can optimize simultaneously. The interactions between upstream and downstream processes create cascading effects that only become visible after the fact.
System of record approach: SCADA captures all process variables. MES records production outcomes. Engineers analyze data offline, sometimes weeks later, to identify root causes of yield loss or throughput constraints.
System of action approach: A digital twin — a real-time virtual replica of the production line — continuously mirrors the physical process using IoT sensor data. AI agents running on the digital twin:
- Simulate the impact of parameter changes before they are applied to the physical line
- Identify optimal setpoints across the entire process chain, not just individual machines
- Detect drift in process capability and recommend corrections before quality is affected
- Coordinate production scheduling with energy costs, material availability, and equipment condition
Measured results: Manufacturers using IoT digital twins as systems of action report 5–15% throughput improvement, 10–30% reduction in scrap and rework, and 8–20% energy savings from optimized process parameters.
Scenario 3: Intelligent Quality Control with Cross-System Correlation
The problem: Traditional quality control catches defects after they’re created. Statistical process control (SPC) flags individual parameter deviations but misses multi-variable quality issues where each individual measurement is within spec but the combination produces defective output.
System of record approach: Quality lab records inspection results. SPC system monitors individual control charts. Customer complaints are logged in the ERP. Root cause analysis happens in post-mortem meetings, often weeks after the event.
System of action approach: AI agents correlate data across incoming material properties, process parameters, environmental conditions, and quality outcomes in real time. When the system detects a combination of factors that historically leads to quality issues:
- Alerts operators before defective parts are produced
- Recommends specific process adjustments to compensate
- Quarantines suspect lots automatically and triggers targeted inspection
- Traces the full process genealogy for any quality event — from raw material lot to finished part to customer delivery
Measured results: Manufacturers using AI-driven quality systems of action report 40–70% reduction in customer quality complaints, 25–50% reduction in scrap costs, and 60–80% faster root cause identification.
Scenario 4: Energy and Sustainability Optimization
The problem: Manufacturing accounts for 30% of global energy consumption. Most factories have no coordinated strategy for aligning energy-intensive processes with optimal pricing periods, renewable availability, or demand response programs.
System of record approach: Smart meters record consumption. Building management system logs HVAC usage. Monthly reports show total cost and peak demand. Energy managers negotiate contracts annually based on historical consumption patterns.
System of action approach: AI agents integrate production schedules, real-time energy prices (day-ahead and intraday markets), equipment efficiency curves, and weather forecasts to:
- Schedule energy-intensive operations (furnaces, large presses, compressors) during off-peak periods
- Automatically participate in demand response programs when production flexibility exists
- Optimize compressed air, steam, and chilled water systems based on actual demand, not fixed setpoints
- Track Scope 1 and Scope 2 emissions in real time against CSRD reporting requirements
Measured results: Manufacturers deploying energy systems of action report 15–25% reduction in energy costs, 10–20% reduction in carbon emissions without production impact, and significant revenue from demand response participation.
Scenario 5: Supply Chain Disruption Response
The problem: When a critical supplier fails or a shipment is delayed, the impact cascades through production scheduling, customer commitments, and financial performance. The response is typically manual, slow, and reactive.
System of record approach: ERP records the supplier shortfall after it occurs. Procurement manually searches for alternative sources. Production planning manually reschedules affected orders. Sales manually notifies affected customers.
System of action approach: AI agents monitoring supplier health signals, logistics tracking, and geopolitical risk factors detect disruptions early and automatically:
- Assess the impact on all affected production orders and customer commitments
- Identify alternative suppliers from the approved vendor list with available capacity
- Generate revised production schedules that minimize customer impact
- Draft customer notifications with updated delivery timelines
- Record the full decision trace — what was considered, what alternatives were evaluated, who approved the deviation
Measured results: Manufacturers using supply chain systems of action report 50–70% faster disruption response time and 20–35% reduction in disruption-related costs. Learn more about AI-driven supply chain and inventory optimization.
Implementation Guide: Building a System of Action with Microsoft Fabric IQ
Microsoft’s Fabric IQ platform — comprising Fabric IQ, Work IQ, and Foundry IQ — provides the architecture to build manufacturing systems of action on top of your existing data infrastructure. Here is a practical implementation guide for each layer.
Architecture Overview: Three IQs, One Context Graph
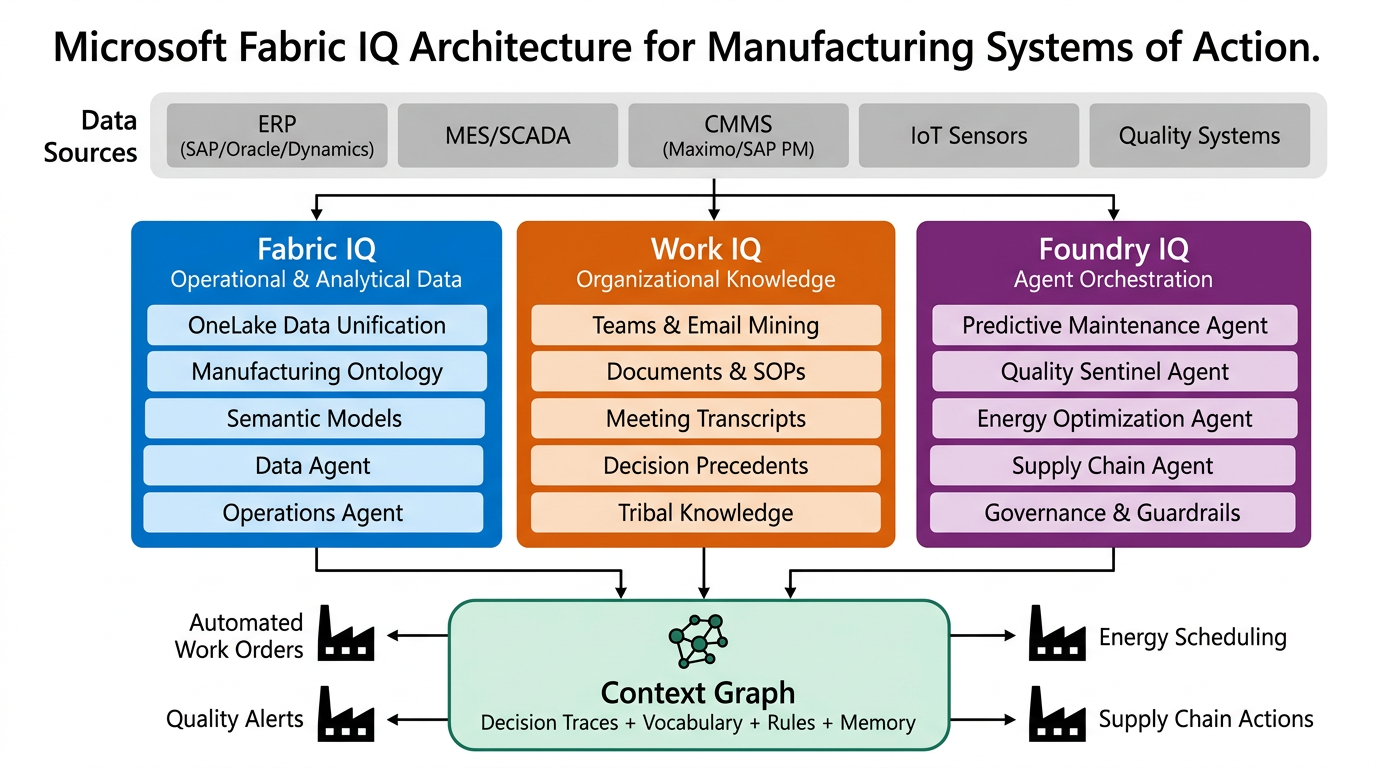
The three components serve distinct but interconnected roles:
- Fabric IQ — The operational and analytical data layer. Connects to your live data in OneLake, defines the ontology (vocabulary and rules), builds semantic models for BI logic, and provides a knowledge graph for multi-hop reasoning. This is where your ERP, MES, SCADA, and IoT data converge into a unified data fabric. It also includes a Data Agent for natural language queries and an Operations Agent that can act on and log against the live data.
- Work IQ — The organizational knowledge layer. Mines your emails, Teams chat threads, documents, policies, meeting transcripts, relationship patterns, and approvals to make tribal knowledge queryable. In a manufacturing context, this captures the “why” behind maintenance decisions, the exception logic for quality holds, and the undocumented relationships between equipment, operators, and process outcomes.
- Foundry IQ — The agent orchestration layer. Provides agent development tools, inherited business context, multi-agent orchestration, governance and guardrails, and agent evaluation and tuning. Agents built in Foundry IQ reason over the combined context from Fabric IQ and Work IQ but don’t execute directly — they propose actions, route approvals, and record decision traces.
All three feed into a unified Context Graph containing vocabulary, rules, traces, and memory — the living record of how your factory makes decisions.
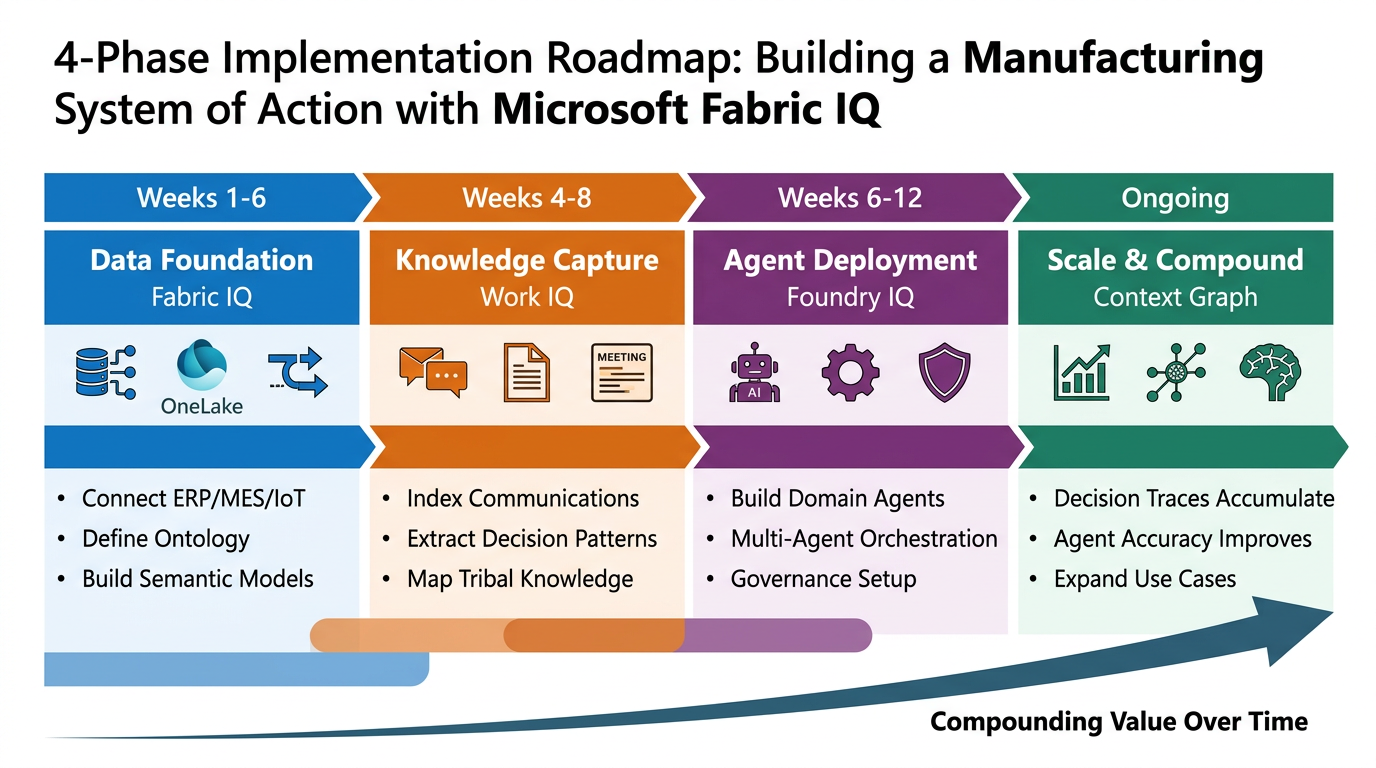
Phase 1: Data Foundation with Fabric IQ (Weeks 1–6)
The first phase connects your operational data sources into Microsoft’s OneLake and establishes the manufacturing ontology.
Step 1: Connect Data Sources to OneLake
Use Fabric IQ’s data connectors to bring in data from:
- ERP — Work orders, purchase orders, BOMs, inventory transactions (via Dataverse, direct SQL, or API connectors)
- MES/SCADA — Production records, batch data, OEE metrics, and process parameters (via OPC-UA, MQTT, or historian connectors)
- CMMS — Maintenance work orders, equipment hierarchies, failure codes, spare parts inventory
- IoT Platform — Real-time sensor data from vibration sensors, thermal cameras, power meters, environmental sensors (via Azure IoT Hub or Event Hubs)
- Quality Systems — Inspection results, SPC data, calibration records, non-conformance reports
Step 2: Define the Manufacturing Ontology
Fabric IQ’s ontology layer maps your factory’s vocabulary and business rules:
- Define entity types: Equipment, Work Center, Product, Material, Supplier, Work Order, Maintenance Event, Quality Event
- Map relationships: Equipment → produces → Product, Material → sourced from → Supplier, Equipment → has_component → Spare Part
- Encode business rules: “Critical equipment” means OEE > 85% target and any unplanned downtime triggers immediate escalation. “Quality hold” requires supervisor approval within 4 hours or auto-escalates to plant manager.
Step 3: Build Semantic Models
Create BI-ready semantic models in Fabric IQ that provide consistent metrics across the organization:
- OEE calculation model (Availability × Performance × Quality) normalized across different MES systems
- Maintenance cost model linking work order costs, spare parts consumption, and downtime financial impact
- Energy consumption model correlating production volume with energy usage at the work center and product level
Phase 2: Organizational Knowledge with Work IQ (Weeks 4–8)
This phase captures the tribal knowledge that lives outside your structured systems — and makes it queryable by AI agents.
Step 4: Index Communication Channels
Work IQ connects to your Microsoft 365 environment to index:
- Teams channels — Maintenance team discussions, shift handover notes, engineering change conversations
- Emails — Supplier communications, customer quality notifications, equipment vendor technical bulletins
- SharePoint documents — SOPs, maintenance manuals, quality procedures, training materials
- Meeting transcripts — Production review meetings, root cause analysis sessions, maintenance planning meetings
Step 5: Extract Relationship Patterns and Decision Precedents
Work IQ’s AI identifies patterns from organizational communications:
- Which maintenance technicians have expertise with which equipment types
- Historical exception decisions — when did plant managers approve deviations from standard maintenance schedules, and why
- Supplier relationship context — negotiation patterns, escalation histories, technical support quality assessments
- Quality exception patterns — which customer complaints led to process changes, and what was the reasoning
Phase 3: Agent Orchestration with Foundry IQ (Weeks 6–12)
This is where the system of action comes alive. Foundry IQ’s agent development tools allow you to build, orchestrate, and govern AI agents that reason across the combined context of Fabric IQ and Work IQ.
Step 6: Build Domain-Specific Agents
Start with these high-impact manufacturing agents:
Predictive Maintenance Agent
- Inputs: Real-time sensor data from Fabric IQ, equipment failure history, spare parts inventory, production schedule
- Context from Work IQ: Past maintenance decisions and their outcomes, technician expertise mapping, vendor support history
- Actions: Generate maintenance recommendations, draft work orders, check parts availability, suggest optimal timing windows
- Governance guardrails: Safety-critical equipment always requires human approval. Cost threshold for auto-approved actions: €5,000.
Quality Sentinel Agent
- Inputs: Real-time process parameters, incoming material certifications, SPC data, environmental conditions
- Context from Work IQ: Historical root cause analyses, customer-specific quality requirements, operator shift performance patterns
- Actions: Flag quality risks before defects occur, recommend parameter adjustments, trigger hold-and-inspect protocols, generate 8D report drafts
- Governance guardrails: Customer-shipment holds always require quality manager approval. Lot disposition decisions log full decision trace to Context Graph.
Energy Optimization Agent
- Inputs: Real-time energy prices, production schedule, equipment efficiency curves, weather forecast
- Context from Work IQ: Past load-shifting decisions and their production impact, operator feedback on schedule flexibility
- Actions: Recommend production schedule adjustments, automatically adjust non-critical system setpoints (compressed air, HVAC), participate in demand response programs
- Governance guardrails: Production schedule changes require operations manager approval. Energy savings targets cannot compromise delivery commitments.
Step 7: Configure Multi-Agent Orchestration
The real power emerges when agents collaborate. Foundry IQ’s multi-agent orchestration enables:
- The Predictive Maintenance Agent and Energy Optimization Agent negotiate maintenance windows that minimize both downtime and energy cost
- The Quality Sentinel Agent flags a material concern, triggering the Supply Chain Agent to assess alternative supplier options while the Production Scheduling Agent evaluates timeline impact
- All agent interactions, proposals, approvals, and outcomes are recorded in the Context Graph, building organizational memory with every decision
Step 8: Establish Governance and Evaluation
Foundry IQ’s governance framework ensures AI agents operate within defined boundaries:
- Decision authority levels: Define which decisions agents can make autonomously vs. which require human approval
- Audit trails: Every agent action is logged with full context — what data was considered, what alternatives were evaluated, what rules were applied
- Agent evaluation and tuning: Track agent recommendation accuracy over time. Retrain on corrections. Measure decision quality, not just throughput.
- Escalation paths: When agents encounter situations outside their training data, they escalate with full context rather than guessing
Phase 4: Continuous Improvement and Scaling (Ongoing)
Step 9: Build the Context Graph Over Time
The Context Graph is the compounding asset. Every decision — whether made by an agent or a human through the system — adds to the graph:
- Maintenance decisions become searchable precedent for future similar situations
- Quality exceptions with their resolution paths become training data for the Quality Sentinel Agent
- Supplier decisions with their rationale become institutional memory that survives employee turnover
- Energy optimization experiments and their results inform increasingly accurate scheduling models
Step 10: Expand to Adjacent Use Cases
Once the foundation is established, extend the system of action to:
- Automated production scheduling — Agents that optimize job sequencing across multiple constraints (due dates, setup times, material availability, energy costs, equipment condition)
- Autonomous quality certification — AI that compiles quality documentation (CoAs, test reports, traceability records) and auto-generates customer-specific quality packages
- Digital twin-driven capacity planning — Simulate factory expansion scenarios, new product introductions, and equipment investments using the digital twin before committing capital
- Regulatory compliance automation — Agents that continuously monitor operations against ISO 9001, IATF 16949, FDA 21 CFR Part 11, and CSRD requirements, flagging non-conformances in real time
The ROI Case: What the Numbers Look Like
For a mid-market manufacturer (€20M–€200M revenue) with 100–500 employees, a system of action built on Microsoft Fabric IQ delivers compounding returns:
| Use Case | Typical ROI (Year 1) | Implementation Timeline |
|---|---|---|
| Predictive maintenance | 35–55% reduction in unplanned downtime; €200K–€800K savings | 8–12 weeks to first predictions |
| AI quality control | 40–70% reduction in quality escapes; €150K–€500K in reduced scrap and warranty costs | 10–14 weeks to production deployment |
| Energy optimization | 15–25% energy cost reduction; €100K–€400K annual savings | 6–8 weeks for initial optimization |
| Supply chain disruption response | 50–70% faster response; €100K–€300K in avoided disruption costs | 8–12 weeks including supplier data integration |
| Digital twin production optimization | 5–15% throughput improvement; €300K–€1.2M additional output | 12–16 weeks for full digital twin deployment |
The critical difference from traditional IT projects: systems of action get better over time. The Context Graph compounds. Agent accuracy improves with every decision. The value in month 12 is significantly higher than in month 1 — without additional investment.
Getting Started: A Practical Path for Manufacturers
The shift from system of record to system of action doesn’t require a rip-and-replace of your existing technology stack. It layers intelligence on top of what you already have. Here is how to begin:
- Pick one pain point with clear financial impact. Unplanned downtime, quality escapes, energy waste, or supply chain disruptions. Choose the one where you can quantify the cost today and measure improvement in 90 days.
- Connect your data to OneLake. Start with the two or three systems most relevant to your chosen use case. You don’t need every data source on day one — you need enough to prove value.
- Build one agent with clear guardrails. Human-in-the-loop for all decisions initially. Let the system prove its judgment before expanding autonomy. Capture every decision trace from day one.
- Measure and expand. After 90 days, evaluate results against your baseline. Use what you’ve learned to expand to the next use case, leveraging the Context Graph and organizational knowledge already captured.
Kamna works with mid-market manufacturers across Europe, the US, and Canada to design and deploy systems of action using Microsoft Fabric IQ and Azure AI. We specialize in the industrial AI scenarios described above — predictive maintenance, digital twins, quality intelligence, and energy optimization — built on top of your existing ERP, MES, and IoT infrastructure. Explore our AI supply chain and inventory solutions or start with our AI Incubation Lab to scope your first system of action project.
Frequently Asked Questions
What is the difference between a system of record and a system of action in manufacturing?
A system of record (ERP, MES, CMMS) stores operational data — production logs, maintenance histories, quality records. It answers “what happened?” A system of action uses AI agents to analyze that data in real time, predict what will happen next, and automatically trigger the right response — generating maintenance work orders before breakdowns, adjusting process parameters before quality issues, or optimizing energy usage based on production schedules. The system of record remains as the data foundation; the system of action adds the intelligence layer.
Do I need to replace my ERP or MES to build a system of action?
No. Systems of action are designed to layer on top of your existing systems. Microsoft Fabric IQ connects to your ERP, MES, CMMS, and IoT platforms via standard connectors. Your existing systems remain the source of truth for transactional data. The system of action reads from them, reasons across them, and writes recommendations or automated actions back.
What is Microsoft Fabric IQ and how does it relate to manufacturing AI?
Microsoft Fabric IQ is a platform comprising three layers: Fabric IQ (operational and analytical data unification via OneLake), Work IQ (organizational knowledge extraction from emails, Teams, documents, and meetings), and Foundry IQ (AI agent orchestration with governance and guardrails). Together, they provide the infrastructure to build manufacturing systems of action — connecting factory data, capturing organizational knowledge, and orchestrating AI agents that automate decisions across maintenance, quality, energy, and supply chain operations.
How long does it take to implement a manufacturing system of action?
A focused implementation targeting one use case (e.g., predictive maintenance) typically delivers first results in 8–12 weeks. A broader deployment covering multiple use cases takes 4–6 months. The system continues to improve after deployment as the Context Graph captures more decision traces and agents learn from operational feedback.
What is a context graph and why does it matter for factory operations?
A context graph is a structured record of how decisions were made — not just what the outcomes were. In manufacturing, it captures why a maintenance engineer chose to replace a bearing early, why a quality hold was placed on a specific lot, or why production was rescheduled around an energy price spike. Over time, this becomes searchable organizational memory that survives employee turnover and enables AI agents to make better decisions by referencing relevant precedents.
What IoT infrastructure do I need for a digital twin?
At minimum, you need sensors on critical equipment (vibration, temperature, power consumption) connected to Azure IoT Hub or a similar platform. Most modern CNC machines, robots, and production lines already have built-in sensors accessible via OPC-UA. The digital twin doesn’t require instrumenting every machine on day one — start with the critical bottleneck or highest-cost equipment and expand as you prove value.